
Research explained
Normal blood sugar levels after eating: what CGMs show
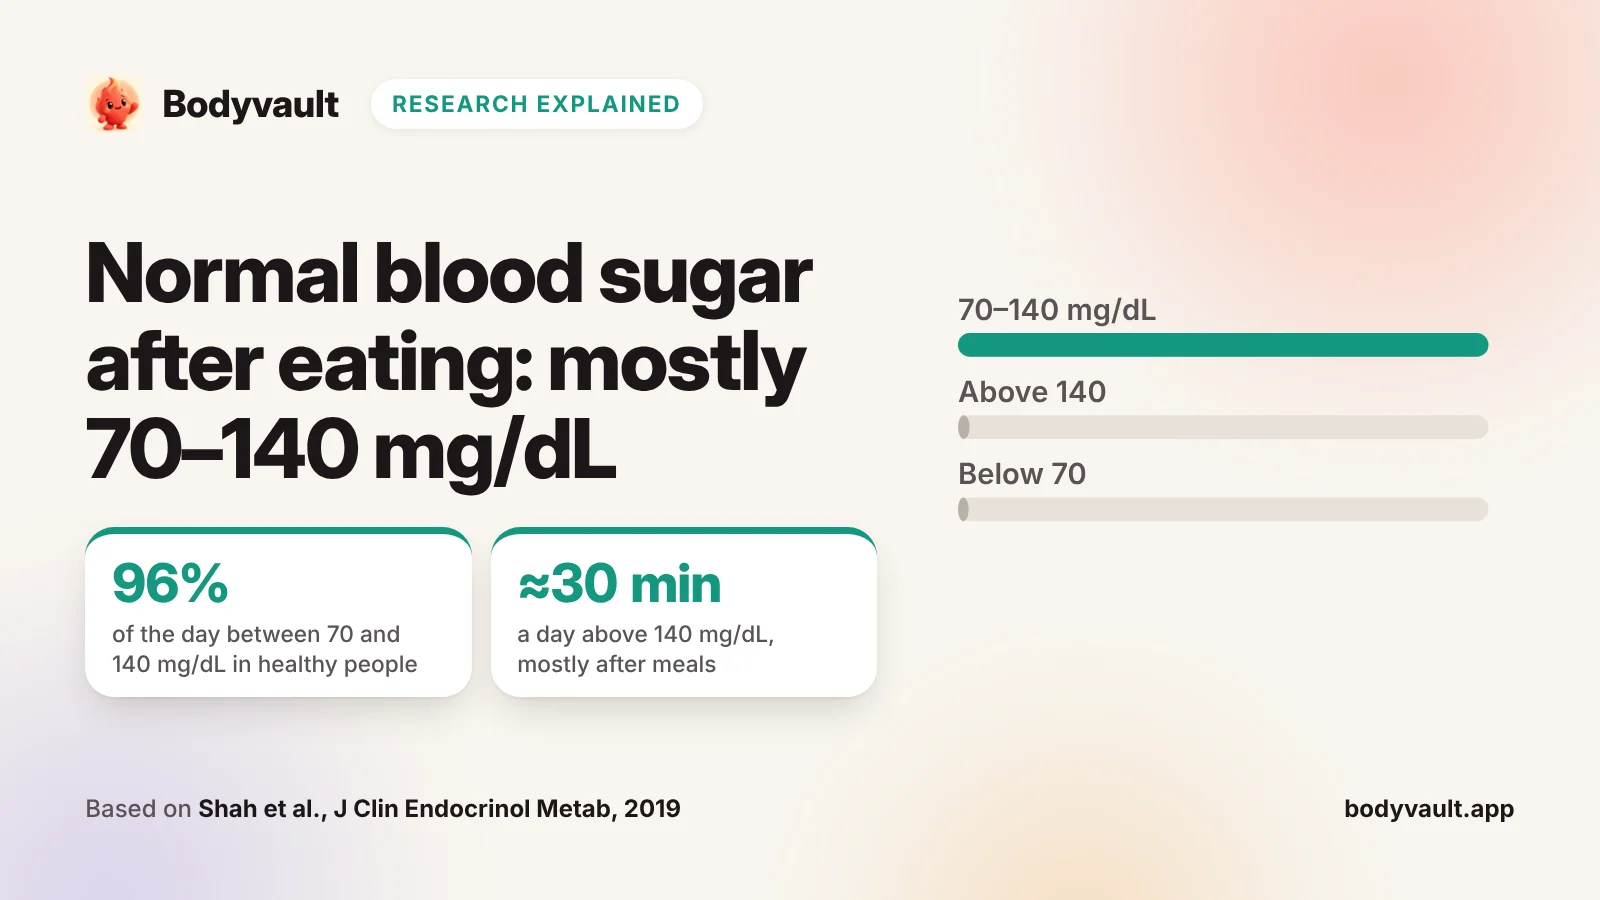
In healthy people wearing a sensor, normal blood sugar levels after eating stayed between 70 and 140 mg/dL for 96% of the day. A normal fasting level is under 100 mg/dL.
The short answer
96%
Of the day that healthy people’s blood sugar stayed between 70 and 140 mg/dL, measured with a sensor
≈30 min
A day above 140 mg/dL, mostly after meals, in the same healthy people
99 mg/dL
Average blood sugar across the day in 153 healthy people aged 7 to 80
<100 mg/dL
Normal fasting blood sugar, below the prediabetes range (American Diabetes Association, 2026)
Strength of evidenceGood
Careful sensor studies of healthy people agree on the usual range, and the cut-offs come from official standards. What bigger rises mean for long-term health in people without diabetes isn’t known yet.
Key findingIn healthy people, blood sugar after eating usually stays under 140 mg/dL, and short rises above it are common. A normal fasting level is under 100 mg/dL. Only lab tests, read by a doctor, can diagnose prediabetes or diabetes.
What is a normal blood sugar level?
Doctors use three blood tests to check blood sugar. Each has its own normal range. The table shows the cut-offs in the American Diabetes Association’s 2026 standards.
| Test | Normal | Prediabetes | Diabetes |
|---|---|---|---|
| Fasting blood sugar (no food for 8 hours or more) | Under 100 mg/dL | 100–125 mg/dL | 126 mg/dL or more |
| 2 hours after a 75 g glucose drink | Under 140 mg/dL | 140–199 mg/dL | 200 mg/dL or more |
| HbA1c (average blood sugar over the past 2 to 3 months) | Under 5.7% | 5.7–6.4% | 6.5% or more |
In mmol/L, used in many countries, 100 mg/dL is 5.6 and 126 mg/dL is 7.0. One high result isn’t enough for a diagnosis: doctors confirm it with a second test. The World Health Organization starts one kind of prediabetes at a fasting level of 110 mg/dL instead of 100.
Normal blood sugar levels after eating: what CGMs show
A CGM (continuous glucose monitor) is a small sensor stuck to the arm that measures sugar under the skin every few minutes. In 2019, researchers gave hidden CGMs to 153 healthy people aged 7 to 80 at 12 US centres. People couldn’t see their readings, so they ate as usual. Each wore the sensor for about 8 days.
So a normal day includes short rises above 140 mg/dL, mostly after meals. Readings above 180 mg/dL were rare. Dips below 70 were short, and some may have come from lying on the sensor at night.
What is a normal blood sugar spike after eating?
It depends on the food and the person. In a 2018 study in California, 57 adults without a diabetes diagnosis wore sensors for 2 to 4 weeks. Thirty of them also ate three set breakfasts, twice each.
A bowl of cornflakes and milk pushed 80% of them above 140 mg/dL. Sixteen people whose standard tests were normal went above 140 mg/dL after at least one breakfast. About a quarter of the people with normal tests had a pattern of big swings. They spent up to 15% of the time above 140 mg/dL.
Does that matter for health? Nobody knows yet. The authors said long-term studies are needed to find out whether these patterns predict diabetes. If you want smaller rises anyway, eating carbs last may help: see food order and blood sugar.
Same food, different rises
Two people can eat the same meal and get very different rises. Researchers in Israel tracked 800 people with sensors for a week, across 46,898 meals. Responses to the same meals varied a lot from person to person. A computer model that used blood tests, diet, activity and gut bacteria predicted each person’s rises, and diets built from it gave smaller rises.
A 2020 study in the UK, called PREDICT 1, tested 1,002 healthy adults, many of them twins. Fasting blood sugar was similar from person to person. The rise after the same meal was not.
The make-up of the meal explained only about 15% of the differences in glucose rises. Genes explained about 10%, and gut bacteria about 6%. Even identical twins could respond differently.
How accurate is a continuous glucose monitor?
A CGM measures sugar in the fluid under your skin, not in your blood. So makers test it against a lab blood analyser. The main number is the average gap between the two, called MARD. A smaller number means closer readings.
The average gap was 8.2% on the arm and 9.1% on the belly for the Dexcom G7, and 7.8% for the FreeStyle Libre 3. So a reading of 150 mg/dL was off by about 12 to 14 mg/dL on average (our calculation), and some readings were further off. Sensors were less accurate just after a new one went on, at low blood sugar and when it changed fast.
These tests were in people with diabetes. In people without diabetes, a 2020 study had 16 adults wear two different sensors at once for 28 days. The two often disagreed about which meals caused the biggest rises. So judge a food over several meals, not one reading.
Over-the-counter CGMs. In March 2024, the US Food and Drug Administration (FDA) cleared the first CGM you can buy without a prescription, the Dexcom Stelo. It is for adults aged 18 and over who don’t use insulin, including people without diabetes. It isn’t for people who get dangerous low blood sugars. The FDA says not to make medical decisions from it without your healthcare provider.
Watches and rings. No smartwatch or ring can measure blood sugar on its own. The FDA warns people not to buy or use any that claim to. Apps that show readings from a real CGM are different.
Does blood sugar change across the menstrual cycle?
A 2023 study in Canada followed 49 women aged 18 to 30 for about three cycles. They wore a CGM and tested their hormones each morning. None had diabetes or used hormonal birth control.
Blood sugar was lowest just before ovulation and highest in the second half of the cycle, the luteal phase. The shift was small: a few mg/dL. But if you compare meals across your cycle, it can add a little noise.
Claims and evidence
ClaimAny reading above 140 mg/dL means something is wrong.
EvidenceHealthy people spent about 30 minutes a day above 140 mg/dL. In one study, cornflakes and milk pushed 80% of people above it.
ClaimA smartwatch or ring can measure your blood sugar.
EvidenceThe FDA has not authorised any watch or ring that measures blood sugar on its own, and warns people not to use them.
ClaimEveryone reacts the same way to the same food.
EvidenceIn 1,002 healthy adults, the rise after the same meal varied far more between people than fasting blood sugar did (68% against 10%).
ClaimA CGM is as exact as a lab blood test.
EvidenceModern sensors were about 8–9% away from a lab test on average. Two sensors worn at once often disagreed about which meals were worst.
ClaimBlood sugar is the same all month.
EvidenceIn 49 young women, it was a few mg/dL higher after ovulation than just before it.
What this means for you
What this means for you
- For a diagnosis, use lab tests read by a doctor: fasting blood sugar, a glucose drink test or HbA1c. A CGM reading is not a diagnosis.
- If you wear a CGM without diabetes, expect short rises above 140 mg/dL after some meals. Look at patterns over days, not single readings.
- Judge a food over several similar meals, and remember that the same food affects people differently.
- Get glucose numbers from a CGM or a finger-prick meter, never from a watch or ring.
- If you have diabetes, take medicine that lowers blood sugar or are pregnant, follow your care team’s targets. If your readings are often high, talk to a doctor.
What the research can’t tell you yet
- What spikes mean for healthy people. No long study shows whether bigger rises after meals in people without diabetes predict future problems.
- Who was studied. The main healthy-people study was 93% white and lasted about a week. The cycle study was in 49 young Canadian women.
- Accuracy in people without diabetes. Sensor accuracy was tested in people with diabetes, in studies run with the makers.
- Older sensors. Some studies used older sensors than the ones sold today.
How Bodyvault uses this research
Meal Impact, part of Bodyvault Pro, takes glucose only from a CGM. It reads LibreView files, or Dexcom, Stelo, Lingo and other sensors that save to Apple Health. Its day view shades 70–140 mg/dL as a typical range for reference. For meals you plan, it shows only a low, medium or high band, never a glucose number. If you track your cycle, cycle phase is one of the things its meal model takes into account.
Share or cite this explainer
Bodyvault (2026). Normal blood sugar levels after eating: what CGMs show. https://bodyvault.app/blog/normal-blood-sugar-levels
The charts on this page may be reused with a link back to it. The underlying data belong to the studies cited below.
Questions
What is a normal blood sugar level?
For adults who aren’t pregnant, a normal fasting level is under 100 mg/dL (5.6 mmol/L). Two hours after a 75 g glucose drink, normal is under 140 mg/dL. An HbA1c under 5.7% is normal.
What range is normal blood sugar during the day?
In 153 healthy people wearing a sensor, blood sugar stayed between 70 and 140 mg/dL for about 96% of the day. The average was 99 mg/dL, and a little higher in people aged 60 and over.
What is a normal blood sugar spike after eating?
Short rises above 140 mg/dL were normal: healthy people spent about 30 minutes a day above it. Readings above 180 mg/dL were rare. Some foods, like cornflakes and milk, push most people above 140.
Should people without diabetes use a CGM?
You can. In the US, the first over-the-counter CGM was cleared in 2024 for adults who don’t use insulin. It can show how meals affect you, but readings vary and what rises mean for healthy people isn’t known. It is not a diagnosis.
How accurate is a continuous glucose monitor?
In studies run with the makers, the Dexcom G7 and FreeStyle Libre 3 were about 8–9% away from a lab blood test on average. About 93–95% of readings were within 20% of it. They are less accurate at low levels and when sugar changes fast.
Sources
- Shah VN et al. (2019). Continuous glucose monitoring profiles in healthy nondiabetic participants: a multicenter prospective study. J Clin Endocrinol Metab 104(10):4356–4364.
- Hall H et al. (2018). Glucotypes reveal new patterns of glucose dysregulation. PLoS Biol 16(7):e2005143.
- Zeevi D et al. (2015). Personalized nutrition by prediction of glycemic responses. Cell 163(5):1079–1094.
- Berry SE et al. (2020). Human postprandial responses to food and potential for precision nutrition. Nat Med 26(6):964–973.
- Garg SK et al. (2022). Accuracy and safety of Dexcom G7 continuous glucose monitoring in adults with diabetes. Diabetes Technol Ther 24(6):373–380.
- Alva S et al. (2023). Accuracy of the third generation of a 14-day continuous glucose monitoring system. Diabetes Ther 14(4):767–776.
- Lin G et al. (2023). Blood glucose variance measured by continuous glucose monitors across the menstrual cycle. NPJ Digit Med 6:140.
- U.S. Food and Drug Administration (2024). Do not use smartwatches or smart rings to measure blood glucose levels: FDA safety communication.
- Howard R, Guo J, Hall KD (2020). Imprecision nutrition? Different simultaneous continuous glucose monitors provide discordant meal rankings for incremental postprandial glucose in subjects without diabetes. Am J Clin Nutr 112(4):1114–1119.
- American Diabetes Association Professional Practice Committee (2026). 2. Diagnosis and classification of diabetes: Standards of Care in Diabetes—2026. Diabetes Care 49(Suppl 1):S27–S49.
- U.S. Food and Drug Administration (2024). FDA clears first over-the-counter continuous glucose monitor. News release, 5 March 2024.
General information about fitness and nutrition, not medical advice. If you have a health condition, are pregnant or take medication, talk to your doctor before changing your diet or training.